This blog entry is based to a large part on text taken from my article first published in the scientific journal Aerosol and Air Quality Research. It is reprinted here under the terms of the Creative Commons Attribution License (CC BY 4.0).
Citation: Riediker, M. and Monn, C. (2020). Simulation of SARS-CoV-2 Aerosol Emissions in the Infected Population and Resulting Airborne Exposures in Different Indoor Scenarios. Aerosol Air Qual. Res. https://doi.org/10.4209/aaqr.2020.08.0531
What was the goal of this study
- To estimate the variability of the viral emission strength in the general infected population when breathing, speaking softly and loudly. Thus, how often do we have to expect that an infected person has low, medium or high virus emissions?
- To package all this complicated statistics into an easy to use tool that allows experts a rapid simulation of a wide range of indoor scenarios.
The result of the second goal is an Indoor Scenario Simulator in the form of a spreadsheet tool (download Excel-file in one of several languages). A user can easily adjust variables such as the virus emitter strength, loudness of speech, physical activity of emitter and exposed person, room characteristics such as room size, ventilation rate and average wind speed, and types of masks worn by emitter and exposed person. The output produced are estimates of the virus concentration in the room and the inhaled dose of other people in the same room.
Attention: the tool is aimed at experts. It has few checks whether your entries makes sense. You need to understand the underlying assumptions and limitations. I recommend it to decision makers, ventilation and workplace planners, occupational and public health experts, and other specialists in the field. Training courses on how to best use the tool will soon be offered.
Modeling the variability of the viral emission strength
How we did it: (read the article for all details) We modelled the distribution of the viral emission strength in the population with a Monte Carlo simulation. First, wet randomly sampled the viral load of a person from the distribution in the general population. We used it to calculate the virus concentration contained in the different sizes of exhaled microdroplets for a randomly drawn aerosol emission strength (also aerosol emissions vary in the population). We then approximated the amount that is likely to stay airborne for prolonged time in turbulent air and scaled the resulting emission strength to talking quietly and loudly. This random drawing process was repeated 100,000 times.
What we found: The Monte Carlo simulation provided the estimated distribution of the viral emitter strength for breathing only, speaking quietly/normally and speaking loudly. The Figure below shows the input distributions and the resulting estimated distribution while speaking quietly, which is multimodal and skewed to the left.
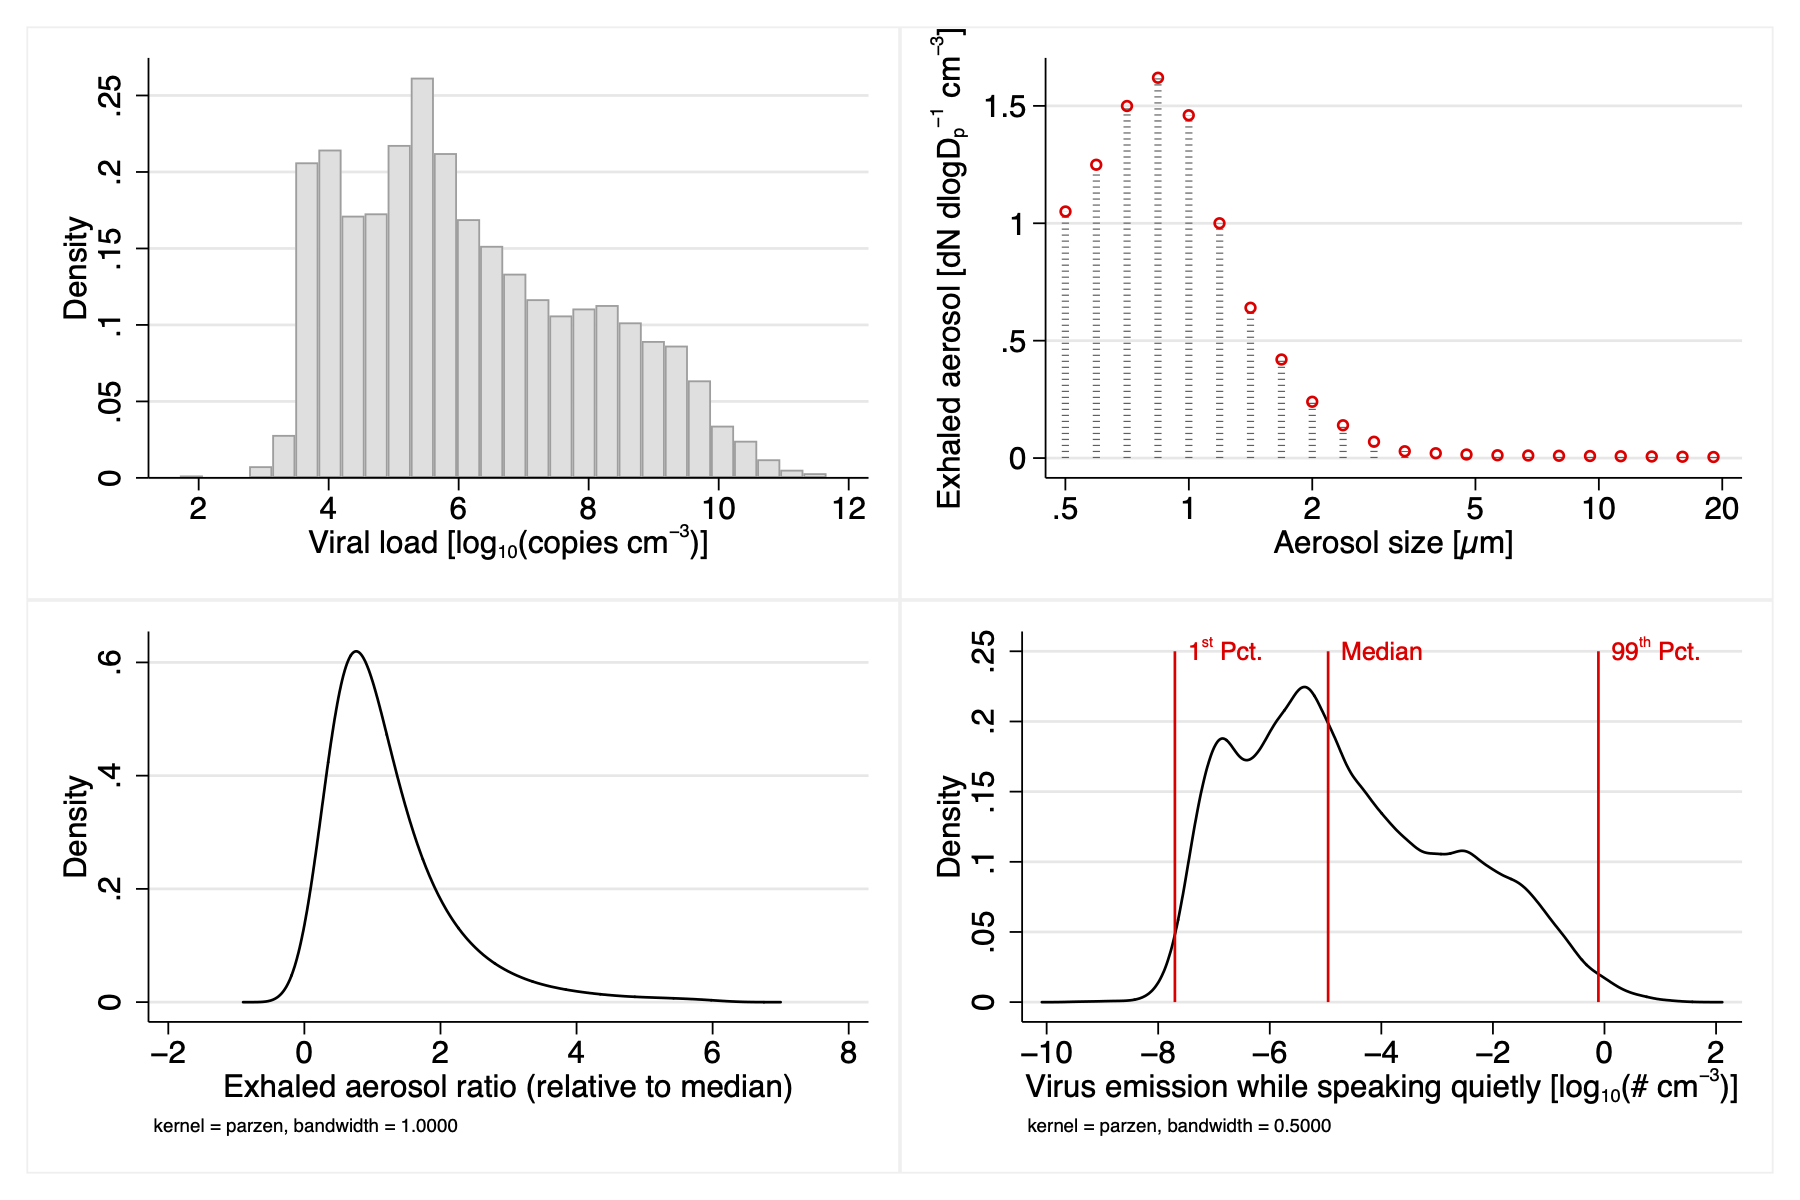
The top one-permille emission (99.9%) of a person breathing quietly is similar to what we reported in our earlier simulation as the upper range of a breathing emitter. What is remarkable is the wide range of emission strength that you expect to see in the general population. Most emit not enough to be relevant for aerosol transmission, as you can see when simulating low and median emitters in the tool. However, about ten percent of the infected population emit sufficient virus to pose a realistic risk, especially if they talk loudly and prolonged in small, ill-ventilated rooms. Super-emitters can infect others even in very large halls.
The spreadsheet tool (download in German / English)
The indoor scenario simulator allows a user to modify the following input parameters: the room volume, the air exchange rate (AER), the average air speed in the room, the time spent by an infected person in the room, the types of masks worn by infected people and bystanders, the type of emitter (from low to super-emitter), the physical activity, the loudness of speech, and the critical dose of virus copies (determined by PCR) that should not be exceeded. AER was defined as the rate of replacing the indoor air by virus-free air, either high-efficiency filtered or fresh outdoor air.
The output parameters of the simulator are the estimated viral levels in the far-field (the background in the room) and the near-field (within 60 cm of the emitter), the cumulative inhaled number of viruses at these two locations and the time until a critical virus dose is reached for different physical activities of the bystander.
The simulator provides the exposure and inhaled dose of a bystander who enters the room at the same time as the emitter, thus at the beginning of the build-up of the room concentration. To obtain the inhaled dose of a bystander entering a room where an infected individual already spent time, one needs to simulate two time points: t1 = (the time spent by the emitter until the bystander enters), and the time t2 = t1+ (the time spent by the bystander), to obtain the dose(late entering) = dose(t2) – dose(t1). The simulator is available in the online supplementary data.
Limitations
Keep in mind that this is a mathematical model, which can never account for all facets or real life. Do not use the tool as sole element for critical decisions. Important limitations include…
- First, the tool is based on a simple model of the mass balance in the near-field and far-field and its assumptions, such as well mixing of the airborne virus in the room.
- Second, sedimentation of aerosols was approximated by using the PM10 fraction of the emitted aerosols because calculating a real sedimentation term would require information on local airstreams and geometry. For short durations, this can underestimate the exposure because not all large aerosol will sediment immediately, while for longer durations, the influence of sedimentation may be underestimated. Thus, for critical scenarios, it would be advisable to use simulations with test aerosols or computational fluid dynamics approaches that assess the fate of all emitted particle sizes including the very large ones, and that takes into account inhomogeneous mixing of the air in a room.
- A third limitation is that aerosol data gained from healthy young people was used to calculate the emission strength. It is likely that the infection with SARS-CoV-2 causes changes in the aerosol size distribution, but it is not certain that this will be similar to what is known for upper respiratory tract diseases, given that asymptomatic individuals infected with the SARS-CoV-2 virus do not report typical upper respiratory tract disease symptoms.
- Fourth, the scenario-builder simplifies viral emissions by defining only one category of emitter-strength, even though high aerosol formation for breathing and talking were reported to not necessarily go together.
- Fifth, the tool provides the number of viral copies determined by RNA testing, but for SARS-CoV-2 it is not yet known how RNA-copies measured in human liquids relate to infective, plaque-forming virus units (PFU).
- Finally, only transmission by aerosols is assessed. This has to be kept in mind in particular when looking at the near-field where spray-processes emitting large droplets are likely to lead to much higher virus exposures.
Keep also in mind that the risk of transmission and infection from exposure depends not only on the viral dose, but also on individual factors such as age, individual susceptibility, preexisting medical conditions and the correct use of protective measures.
What do we find when using the tool
We simulated a range of office situations, walk-in businesses such as small shops, boutiques, restaurants and discos; transportation when travelling by train, bus, car and air; and also tried to reproduce documented super-spreading events. Read the article for what we found.
Overall, these simulations document the positive effects of wearing masks and increasing ventilation, and the contribution of viral load, speaking and physical activity. The parameter driving the risk is in most scenarios the emission rate of the infected person: In most cases, the presence of a super-emitter (99.9 %) or very high emitter (99 %) was required to reach a critical number of inhaled copies. In very small rooms with poor ventilation (e.g. sitting in a car), already a high emitter (90 %) was sufficient, especially if the emitter was singing or talking loudly. Wearing simple surgical/hygiene masks was very effective in almost all cases. However, this assumed that the mask were fit and properly worn. Personal observation in public spaces suggests that this does not always hold, which has to be considered when doing risk assessments for populations that have difficulties following guidelines and rules.
The comparison to documented super-spreading events suggests that these infective events could be explained by the airborne route and that an estimated dose of a few thousand virus copies may be sufficient to infect a large proportion of exposed people.
How much virus is needed to get sick? What is the critical dose?
The dose necessary to infect humans is subject to ongoing research. For many viruses, a few hundred to a thousand plaque forming units (PFU) are sufficient to infect a human. For SARS-CoV-1 (the epidemic that started in 2002), it was suggested that at a dose of 280 plaque forming units, 50% of the people would get infected, while the lowest dose that infected somebody was estimated at 16 PFU. For SARS-CoV-2 (causing COVID-19 in the current coronavirus epidemic), virologists estimate that the infective dose is in a similar range though slightly higher than for SARS-CoV-1 . PFUs are not identical to the number of viral copies determined by polymerase chain reaction (PCR), since several hundred „virus copies“ can be present per PFU. When aiming to prevent infections, a “critical dose” that should not be exceeded can be defined as a few PFU, which probably corresponds to a few hundred viral copies determined by PCR. Research on the minimal infective dose of SARS-CoV-2 is ongoing and may still move this “critical dose” up or down.